
Across London’s expensive postcodes, the third quarter was a quieter one. Benham and Reeves tracks demand for homes between £2m and £10m, and its latest Prime London Demand Index shows the core market cooling by 1.3% on the previous quarter. Clapham bucked that mood in one respect: it still topped the table for how many prime homes actually found a buyer. Whether you’re selling, buying or renting out in SW4 and SW11, the detail behind that number is worth understanding. Reach out to our Clapham lettings specialists.
What the index actually measures
It’s less complicated than it sounds. The index looks at all the homes listed for sale in a price band and works out what proportion are already sold subject to contract. A higher percentage means more of what’s on the market is being snapped up.
Across prime London as a whole, that figure sat at 13.2% in Q3 2026. In Clapham, 42.7% of homes listed between £2m and £10m had secured a buyer. That’s more than three times the London-wide level.
Clapham at the top, with Wandsworth close behind
Wandsworth came second at 41.5%, then Islington at 37.2%. Chiswick (31.3%), Richmond (28.2%), Putney (28%), Maida Vale (25.4%) and Wimbledon (25.1%) all saw more than a quarter of prime homes find a buyer.
Look at that list and there’s a pattern. Most of these are family-focused areas with green space, good schools and decent transport. The quieter side of London, in other words, rather than the glossy central postcodes.
Why family buyers favour Clapham
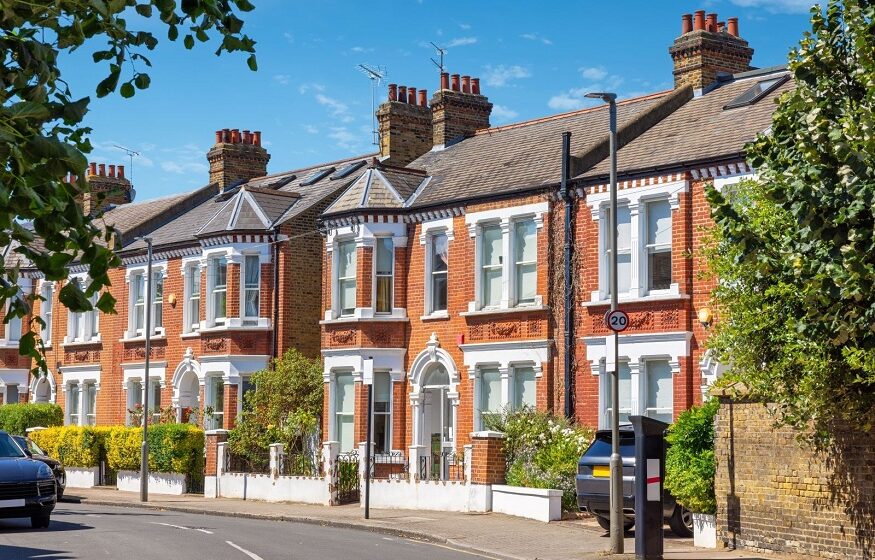
At £2m and above, Clapham is mostly houses. Think big Victorian and Edwardian family homes around the Common, in the Old Town and in Abbeville Village, plus the occasional exceptional flat or conversion. These are homes bought by people who plan to stay a while.
We see this quite often: buyers at this level are rarely hunting for a bargain. They’re after the right house on the right road, and when it appears they move. Add the Common on the doorstep, the Northcote Road shops and cafés, and the Northern line and Clapham Junction links, and you can see why the area holds its pull.
Family buyers also tend to be less rattled by short-term swings. They’re making a lifestyle decision.
Not everything was rosy
Here’s the part that often gets missed. Clapham led on demand, yet its quarterly movement was a fall of 4.9%. Among the bigger movers, only Chiswick (-6.5%) dropped further, with Belgravia matching Clapham and Putney down 4.5%.
So Clapham’s demand is high, but it softened compared with Q2. Both things are true.
A strong market and a rising market aren’t the same thing. Buyers are still active, but a touch more selective than a few months earlier.
Read More: Why Dunstable Downs Is a Big Draw for Families Buying Their Next Home
Where demand was gaining
The strongest quarterly growth came from central London. Fitzrovia rose 5.4% and Islington 4.8%, with Canary Wharf at 4.5% and Maida Vale at 4%. Hampstead, Mayfair, Pimlico, Marylebone and Knightsbridge also edged up.
That doesn’t mean buyers abandoned south-west London. Some central markets caught up while the family belt cooled slightly from a very high base.
A quick look at the super-prime end
Above £10m the story was different. Demand there edged up 0.7% to 4.3%. Pimlico stood out with 50% of super-prime homes under offer, followed by Maida Vale at 14.3%, Knightsbridge at 8.8%, Highgate at 7.7%, Chelsea at 6.7% and Victoria at 5.7%.
Clapham barely features at that level, because very few homes here reach £10m. The top of the market and the family-house market are driven by different buyers, and they don’t always move together.
A word of caution on the percentages
Prime stock is thin. Where only a modest number of homes are listed above £2m at any one time, a handful of sales or withdrawals can swing the percentage noticeably.
It also measures demand, not price. A high sold-subject-to-contract rate doesn’t tell you what homes sold for, or how far they came down from the asking price. Buyers usually ask about this, and the honest answer is that you need to look at individual sales on individual streets.
Read More: The Complete Guide to Gas Pipes: Types, Uses and Benefits
If you’re selling
Strong demand favours well-presented, realistically priced homes. A prime house priced a little ambitiously is likely to sit, even in a market this busy.
If you’re buying
Competition for the best family homes is real, so having finance and your own sale lined up matters. The softer quarterly movement may leave more room for sensible negotiation than a year ago.
If you’re a landlord
Larger Clapham houses suit families and relocating professionals. If you’re weighing letting against selling, compare likely net rent with what a sale would realistically achieve.
Looking ahead
Q4 will show whether Clapham’s slip was a pause or the start of a trend. For now it remains one of London’s most sought-after areas for family homes.